1. ECONOMIC INDICATORS
UK
- UK Gross Domestic Product (GDP) was estimated to have increased by 0.8% in Q1 2014.
- Consumer Price Index (CPI) annual inflation was 1.8% in April 2014, up from 1.6% in March.
- For January to March 2014, the unemployment rate was 6.8%, down by 0.4% from October to December 2013 and down by 1% from a year earlier.
- Pay including bonuses for employees in Great Britain for January to March 2014 was 1.7% higher than a year earlier, with pay excluding bonuses 1.3% higher.
- UK house prices increased by 9.1% in the year to February 2014, up from 6.8% in the year to January 2014.
- Production output increased by 3% in April 2014, compared with April 2013.
- Manufacturing output increased by 4.4% in April 2014, compared with April 2013.
- In the year to April 2014 the output price index for home sales of manufactured products rose 0.6%. In the same period the total input price index fell by 5.5%.
- The Index of Services increased by 3.1% in March 2014 compared with March 2013.
- The seasonally adjusted estimate of construction output in Q1 2014 rose by 0.6% (£180 million) when compared with Q4 2013.
- In April 2014, the quantity bought in the retail industry increased by 6.9% compared with April 2013 and by 1.3% compared with March 2014.
- Public Sector Net Borrowing in April 2014 was £11.5bn. For the financial year 2013/14 it was £107.4 bn.
- In Q1 2014, business investment rose by an estimated £0.9 billion (2.7%) to £32.8 billion compared with the previous quarter and was 8.7% higher compared with Q1 2013.
- The UK’s deficit on seasonally adjusted trade in goods and services was £2.5 billion in April 2014. The deficit on trade in goods was £9.6 billion. The surplus on trade in services was estimated at £7.1 billion.
- There was a current account deficit of £22.4 billion in Q4 2013, down from a revised deficit of £22.8 billion (originally published as a deficit of £20.7 billion) in Q3 2013. In 2013, the UK’s current account deficit was £71.1 billion.
- Overseas residents made 5.6% more visits to the UK in 2013 compared with 2012. Earnings from visits to the UK rose by £2.4 billion (12.7%) compared to 2012 to reach a record level of spending in the UK of £21 billion.
- In 2013, UK residents made 3.5% more visits abroad than in 2012 and spent £2.5 billion (7.6%) more during these visits.
- The number of visits to the UK by overseas residents in March 2014 rose by 10%, when compared to March 2013.During the period January 2014 to March 2014, overseas residents made 10% more visits to the UK than in the corresponding period a year earlier and they spent 19% more on these visits. In the 12 months to March 2014 the number of visits to the UK was 7% higher than a year earlier and earnings grew by 14%.
- The estimated number of visits abroad by UK residents in March 2014 was 3.44 million, which is a fall of 2% when compared to the number of visits abroad in March 2013. During the period January 2014 to March 2014, the number of UK residents’ visits abroad increased by 7% when compared with the corresponding period a year earlier, but they spent 8% less on these visits. In the 12 months to March 2014 the number of visits abroad by UK residents grew 5% when compared with a year earlier and expenditure on these visits rose by 6%.
For previously released UK economic indicators visit National Statistics: Link
LONDON
- London’s annual growth in output decreased to 3.2% in Q3 2013 from an upwardly-revised 4.1% in Q2 2013.
- London’s annual employment growth remained unchanged at 3.9% in Q3 2013 from an upwardly-revised figure for Q2 2013.
- Annual house price inflation in London was 15.7% in Q1 2014, up from 15.3% in Q4 2013.
- The percentage of the resident working age population who are unemployed and claiming Jobseekers’ Allowance in London remained unchanged in April 2014 at 2.8%. There were 157,700 seasonally adjusted unemployment claimants in London in April 2014 compared to 161,300 in March 2014.
- The Purchasing Managers’ Index (PMI) of business activity recorded 62 in April 2014, compared to 59.5 in March 2014.
- The PMI for new orders for London firms recorded 61.6 in April 2014 compared to 60.6 in March 2014.
- The PMI for the level of employment in London firms was 55.1 in April 2014, compared to 53.3 in March 2014.
- The RICS Residential Market Survey shows a positive net balance of 44 for London house prices over the three months to April 2014.
- The net house price expectations balance in London was 49 in April 2014.
- For Greater London, the consumer confidence score decreased to -3 in April 2014 from -2 in March 2014.
- In the most recent 30 day period, (from 2 March 2014 to 31 March 2014) London’s underground and buses had 296.1 million passenger journeys; 195.7 million by bus and 100.3 million by Underground.
- The moving average annual rate of growth in passenger journeys increased to 2.5% from 2.2% in the previous period.
For more information please visit: Link
US
- Real gross domestic product (GDP) decreased at an annual rate of 1% in Q1 2014.
- In Aril 2014, personal income increased $43.7 billion, or 0.3%, disposable personal income (DPI) increased $44.6 billion, or 0.3% and personal consumption expenditures (PCE)
- decreased $8.1 billion, or 0.1%.
- The April 2014 international trade deficit increased 6.9% from March, to $47.2 billion. Exports decreased 0.2%, to $193.3 billion, and imports rose 1.2%, to $240.6 billion.
- The US current account deficit decreased to $81.1 billion or 1.9% of current-dollar gross domestic product (GDP) in Q4 2013, from $96.4 billion, or 2.3% of GDP in Q3.
- The US current account deficit decreased to $379.3 billion or 2.3% of current-dollar GDP in 2013, from $440.4 billion or 2.7% percent of GDP in 2012.
- Real spending on travel and tourism accelerated in Q4 2013, increasing at an annual rate of 4.2% after increasing 3.1% (revised) in Q3 2013. For the year, real spending on travel and tourism increased 3.6% in 2013 after increasing 2.8% in 2012
For previously released US economic indicators visit US Bureau of Economic Analysis (BEA): Link
NY
- Private employment rose in New York City by 3,100 between February and March 2014.
- The unemployment rate rose to 8% in March 2014 from 7.9% in February.
- The Manhattan Class A office vacancy rate was 10.1% in April 2014, while the average asking rent was $70 PSF.
- The Manhattan hotel occupancy rate in March 2014 was 85.7%, down from 87.6 in March 2013.
- Passengers in NYC area airports totaled 7.3 million in February 2014, down 1.2% from February 2013.
- In April 2014, the Manhattan Class A direct vacancy rate rose to 10.1% while the average rental rate remained at $70 PSF.
- In the same month, the Downtown Class A direct vacancy rate rose to 13.1% and the rental rate remained at $55 PSF.
- The Manhattan Class A sublease vacancy rate fell to 1.7% from 1.8% from March to April.
- For the twelve months ending March 2014: Building projects (including new, additions and alterations) that started construction in NYC rose by 8%, and infrastructure (non-building) project starts fell by 10.3% from the twelve months ending March 2013.
- Planned space for building project starts rose by 11% from the same period in 2013.
- 2,881 residential building project starts began construction, a 12.3% increase from the twelve months ending in March 2013. These starts contained 21,931 units, an increase of 21.4% from last year.
- In February 2014, 7.3 million passengers flew into and out of the region’s airports, a decrease of 1.2% from February 2013.
- Domestic air carriers accounted for 4.8 million passengers, a 3.6% decrease from February 2013.
- 2.5 million passengers traveled with international air carriers in February 2014, a 3.9% increase from February 2013.
- Total ridership on MTA subways, trains and buses in March 2014 was 232.5 million, an increase of 3.7% from March 2013.
- Subway ridership in March 2014 was 148.4 million, which was a 4.2% increase from March 2014.
- Total Broadway attendance was approximately 1.2 million during the four weeks ending April 27, 2014, up 18% from the same period last year.
- Broadway revenue during this period was about $122.5 million, up 24.5% from last year.
- In March 2014, the average daily hotel room rate was $249, a 4.9% decrease from March 2013.
- Hotel occupancy was 85.7% in March 2014, down from 87.6% in March 2013.
- Rooms charging over $350 per night were the only category that had an increase in the daily hotel room rate.
For more information please visit: Link
Euro Zone
- GDP rose by 0.2% in the euro area in Q1 2014, compared with the previous quarter. In Q4 2013, GDP grew by 0.2% in the euro area. Compared with the same quarter of the previous year, seasonally adjusted GDP rose by 0.9% in the euro area in Q1 2014.
- The Euro area unemployment rate was 11.7% in April 2014, down from 11.8% in March 2014, and from 12% in April 2013.
- The Euro area annual inflation was 0.5% in May 2014, down from 0.7% in April.
- In March 2014 compared with February 2014, seasonally adjusted industrial production fell by 0.3% in the euro area. In March 2014 compared with March 2013, industrial production dropped by 0.1% in the euro area.
- In April 2014, compared with March 2014, the industrial producer prices fell by 0.1% in the euro area. In April 2014 compared with April 2013, industrial producer prices decreased by 1.2% in the euro area.
- In March 2014 compared with February 2014, production in the construction sector fell by 0.6% in the euro area. In March 2014, compared with March 2013, production in construction increased by 5.2% in the euro area.
- In April 2014 compared with March 2014, the volume of retail trade rose by 0.4% in the euro area. In April 2014, compared with April 2013, retail sales index increased by 2.4% in the euro area.
- House prices, fell by 1.4% in the euro area in Q4 2013, compared with the same quarter of previous year. Compared with Q3 2013, house prices fell by 0.7% in the euro area.
- In Q4 2013, business investment rate was 19.5% in the euro area, compared with 19.2% in Q3 2013.
- The first estimate for the euro area trade in goods balance with the rest of the world in March 2014 gave a 17.1 billion euro surplus compared with +21.9 billion in March 2013.
- The EU28 external current account recorded a surplus of 32.2 billion euro (1% of GDP) in Q1 2014, compared with a surplus of 36.3 billion (1.1% of GDP) in Q4 2013 and with a surplus of 34.9 bn (1.1% of GDP) in Q1 2013.
- In Q3 2013, the EU28 made direct investment abroad of 50.9 billion euro, compared with 62.7 billion in Q3 2012, while direct investment from the rest of the world into the EU28 was 30.4 billion, compared with 89.1 billion in the same quarter of 2012. Portfolio investment recorded a net outflow of 58.5 billion compared with a net outflow of 171.6 billion in Q3 2012.
For more information please visit: Link
2. INVESTMENT INDICATORS
UK Inward Investment 2013
Inward investment projects into the UK rose by 15% last year, as it retained its position as Europe’s number one destination for global investors while simultaneously increasing its market share. The 799 projects were the highest number ever secured by the UK according to professional services firm EY’s annual UK Attractiveness Survey.
The overall European market grew by just 4%, meaning the UK secured one-fifth of all European projects, close to its record high over the past decade. Its performance saw the UK extend its lead over second-placed Germany as a Foreign Direct Investment (FDI) destination, as both countries pulled away from the remainder of Europe.
The UK has also moved from eighth to fifth in the worldwide ranking of countries investors regard as attractive for FDI over the next three years – its highest ever position – overtaking Germany for the first time. Only China, the United States, India and Brazil are ahead of the UK.
The UK was the clear leader in attracting projects in the knowledge industries. Software investments surged by more than 50%, meaning the UK secured more than a third of all projects in what is now Europe’s largest FDI sector.
It also attracted 52 research and development (R&D) projects. That was 20% more than Germany, giving the UK a Europe leading market share of 18% R&D FDI. The UK also led the way on headquarters, contact centres, logistics, international distribution centres and sales & marketing projects.
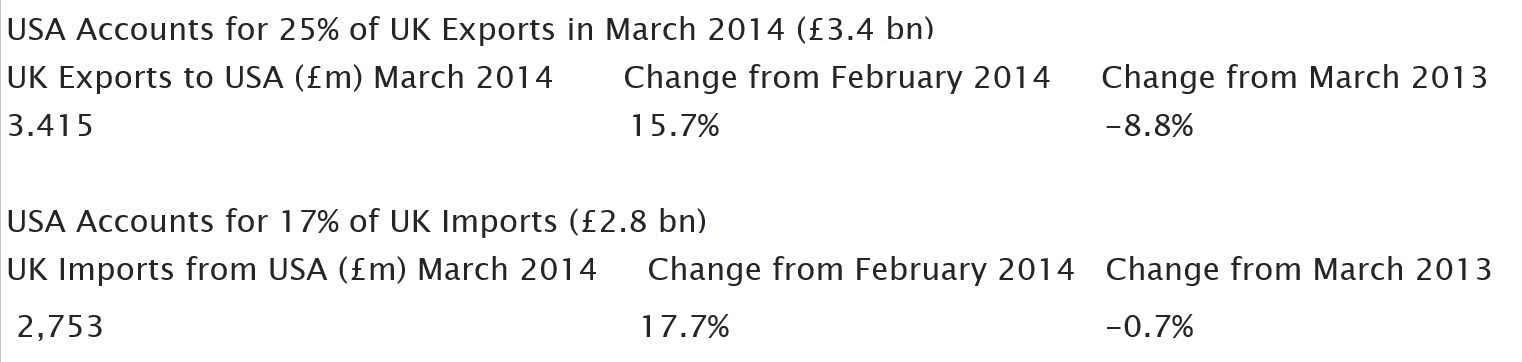
3. UK/US EXPORTS/IMPORTS
4. UK/EU & Non-EU Exports/Imports
2013 UK Trade with EU Member States
The total EU export trade for 2013 is £151 billion, which is marginally greater than the £150 billion in 2012 (0.5% increase).
The total EU import trade for 2013 is £219 billion, which is greater than the figure of £209 billion in 2012 (4.5% increase).
Total Monthly UK Trade with EU Member States: March 2014
EU Exports for March 2014 are £13.3 billion. This is an increase of £1.4 billion (12%) compared to last month.
EU Imports for March 2014 are £19.1 billion. This is also an increase of £1.4 billion (7.9%) compared to last month.
The UK remains a net importer, with imports exceeding exports by £5.8 billion. This is a slight decrease of £29 million (0.5%) compared to last month.
2013 UK Trade with non-EU Member States
The total non-EU export trade for 2013 is £200 billion, which is substantially greater than the £153 billion in 2012 (30% increase).
The total non-EU import trade for 2013 is £201 billion, which is a reduction when compared to £232 billion in 2012 (14%).
Total Monthly UK Trade with non- EU Member States: March 2014
Non-EU Exports for March 2014 are £13.6 billion. This is a decrease of £0.82 billion (5.6%) compared to last month.
Non-EU Imports for March 2014 are £15.7 billion. This is an increase of £1.5 billion (10.6%) compared to last month.
The UK is a net importer this month, with imports exceeding exports by £2.1 billion.
5. NEW INVESTMENTS
US Investments into UK
LabTech Software opens new UK office
US LabTech Software, a remote monitoring and management (RMM) platform provider, is opening a new office in the UK, marking another step forward for this managed service provider (MSP) tools vendor. In addition to the new UK office, LabTech has partners in the United States, Australia, Canada and Ireland that have helped this ConnectWise Capital company extend its global Investments into the UK.
LabTech Software, 4110 George Rd, Suite 200, Tampa, FL 33634. Tel: 813 397 4600 website: www.labtechsoftware.com
Latisys expands into the UK
Colorado-based data centre services firm Latisys Corporation has launched a data centre in London to serve emerging enterprise customer needs. The expansion is the result of accelerating demand for high performance, scalable and high-touch Latisys solutions — particularly among mid-to-large multinational enterprises with a significant footprint in the US and infrastructure needs abroad.
Latisys-Denver, LLC, 393 Inverness Parkway, Englewood, CO 80112 Tel: 303 268 1470Web: www.latisys.com
UK Investments into the US
John Laing opens US office
John Laing, the international infrastructure investor and asset manager, is pleased to announce that the company is strengthening its team in the US, whist opening an office in New York City. Anthony Phillips, currently Head of Asia Pacific for John Laing, is moving to New York in order to take on the role of Head of North America. John Laing’s new presence in the US underlines the company’s strategy of international growth and builds on existing offices in Canada, Australia, New Zealand, the Netherlands as well as the UK.
John Laing plc, 1 Kingsway, London WC2B 6AN. Tel: +44 (0)20 7901 3200 Fax: +44 (0)20 7901 3520 Email: enquiries@laing.com Website: http://www.laing.com
Moogsoft opens second US office
UK-based Moogsoft, the leading provider of service assurance software for IT and telecommunications, announced the opening of a New York City area office in Hoboken, NJ. The company also announced the appointment of Richard Whitehead as Evangelist in Chief for Incident. MOOG.
Moogsoft Ltd, Olympic House, 63 Wallingford Road, Uxbridge, Middlesex UB8 2RW. Email: info@moogsoft.com website: www.moogsoft.com
U.S. 415 738 2299 or 646 843 0455
Forbidden Technologies opens office in the US
Forbidden Technologies, the AIM-quoted owner and developer of the market-leading cloud-based video platform FORscene, announced that it has opened an office in Burbank, Calif., to boost support for North American customers. Forbidden’s Burbank office is located at 2600 W. Olive Ave., on the fifth floor. Brian Boring serves as general manager and is the primary contact for Forbidden’s North American operations.
Forbidden Technologies plc, Tuition House, 27-37 St. George’s Road, Wimbledon, London SW19 4EU Tel:+44 (0)20 8879 7245 Fax:+44 (0)20 8946 Email: info@forbidden.co.uk Website: www.forbidden.c.uk
Forbidden Technologies, 2600 W. Olive Ave., Burbank CA
6. TRADE SHOWS
UK
June 17-19, 2014- Internet World — Excel London
Website: Link
“Internet World is Europe’s longest running, best attended and biggest annual event for digital marketing and online business, attracting over 10,000 visitors and more than 300 exhibitors.”
Contact:Richard Stanbridge, Senior Commercial Specialist/Head of Industries TeamTel: +44 (0)20 7894 0437 Email: Richard.Stanbridge@trade.gov
June 17-19, 2014 IFSEC International 2014 -– Excel London
Website: Link
“IFSEC is the world’s leading global annual security event, uniting over 25,000 security professionals with more than 600 world leading companies.”
Contact: PJ Menner, Commercial Specialist Tel: +44 (0)20 7894 0470 Email: PJ.Menner@trade.gov
July 14-20, 2014 – Farnborough International Airshow -Farnborough Aerodrome
Website: Link
Farnborough International Airshow is the biggest, most internationally attended aerospace event in the world – a globally renowned showcase of aerospace equipment and technology. It provides the perfect venue for the world’s civil and military aerospace suppliers and their customers to meet and discuss, finalise and announce their business transactions.
Contact: PJ Menner, Commercial Specialist, Tel: +44 (0)20 7894 0470 Email: PJ.Menner@trade.gov
US
June 14-20 – InfoComm 2014 – Las Vegas, NV
Website: Link
InfoComm 2014 is the largest professional AV show in the world, with more than 950 exhibitors and 35,000+ attendees from over 110 countries. This is your once-a-year opportunity to see the latest audiovisual technology, learn the skills that will advance your career, and grow your professional network.
June 19-21 – 2014 International Franchise Expo – New York, NY
Website: Link
Join thousands of entrepreneurs and business owners at the International Franchise Expo, the largest franchise expo in the country. Meet hundreds of proven franchise opportunities. Every industry. Every investment level. Full-time and part-time.
June 29-July 1 – Fancy Food Show (Summer) 2014 – New York, NY
Website: Link
North America’s Largest Specialty Food & Beverage Event will be in New York City from June 29 – July 1, 2014. Discover 180,000 products including confections, cheese, coffee, snacks, spices, ethnic, natural, organic and more. Connect with 2,400 exhibitors from 80 countries & regions.
July 27- 31 – 2014 AACC Annual Meeting & Clinical Lab Expo – Chicago, IL
Website: Link
Connect with global leaders in clinical chemistry, molecular diagnostics, mass spectrometry, translational medicine, lab management, and other areas of breaking science in laboratory medicine. Learn about cutting edge technology. The AACC annual meeting has more than 200 new product introductions each year. Hear vital research and learn about important changes in the field. With more than 200 educational opportunities in Lectures, Plenary Sessions, Symposia, Short Courses and Brown Bag Sessions, you can design an educational experience that best meets your professional needs.
August 17-20 -MAGIC MARKET PLACE (Summer) 2014 – Las Vegas, NV
Website: Link
MAGIC is the largest global marketplace for contemporary men’s and women’s apparel, footwear, accessories and sourcing resources — and the world’s most comprehensive forum for fashion buyers and brands. Every February and August, the industry convenes in Las Vegas for connection, inspiration and to shop a portfolio of ten expertly merchandised and curated shows across every category, trend and price point. With more than $200 million in orders written daily, MAGIC fuels the business of fashion.
August 20-23 – International Woodworking Machinery & Furniture Supply Fair- Atlanta, GA
Website: www.iwfatlanta.com
The International Woodworking Fair, LLC is the premier trade show event for the industry. Our business is to connect you with the most qualified buyers in the industry. Buyers come from all over the globe to see, evaluate and buy machinery, supplies and services
August 26-28 –Farm Progress Show – Boone, IA
Website: Link
The Nation’s largest outdoor farm show.
For more information please visit: Link