1. ECONOMIC INDICATORS
UK
- UK Gross Domestic Product (GDP) was estimated to have increased by 0.8% in Q1 2014.
- Consumer Price Index (CPI) annual inflation was 1.5% in May 2014, down from 1.8% in April.
- For January to March 2014, the unemployment rate was 6.8%, down by 0.4% from October to December 2013 and down by 1% from a year earlier.
- Pay including bonuses for employees in Great Britain for January to March 2014 was 1.7% higher than a year earlier, with pay excluding bonuses 1.3% higher.
- UK house prices increased by 9.9% in the year to April 2014, up from 8.0% in the year to March 2014.
- Production output increased by 3% in April 2014, compared with April 2013.
- Manufacturing output increased by 4.4% in April 2014, compared with April 2013.
- In the year to May 2014 the output price index for home sales of manufactured products rose 0.5%. In the same period the total input price index fell by 5.0%.
- The Index of Services increased by 3.1% in April 2014 compared with April 2013
- The seasonally adjusted estimate of construction output in April 2014 rose by 1.2% when compared with March 2014.
- Year-on-year estimates of the quantity bought in the retail industry continued to show growth in May 2014. The quantity bought increased by 3.9% compared with May 2013. Month-on-month the quantity bought fell by 0.5% compared with April 2014.
- Public Sector Net Borrowing in May 2014 was £13.3bn. For the financial year 2013/14 it was £107 bn.
- In Q1 2014, business investment rose by an estimated £0.9 billion (2.7%) to £32.8 billion compared with the previous quarter and was 8.7% higher compared with Q1 2013.
- The UK’s deficit on seasonally adjusted trade in goods and services was £2.5 billion in April 2014. The deficit on trade in goods was £9.6 billion. The surplus on trade in services was estimated at £7.1 billion.
- There was a current account deficit of £18.5 billion in Q1 2014, down from a revised deficit of £23.5 billion (originally published as a deficit of £22.4 billion) in Q4 2013.
- Overseas residents made 5.6% more visits to the UK in 2013 compared with 2012. Earnings from visits to the UK rose by £2.4 billion (12.7%) compared to 2012 to reach a record level of spending in the UK of £21 billion.
- In 2013, UK residents made 3.5% more visits abroad than in 2012 and spent £2.5 billion (7.6%) more during these visits.
- The number of visits to the UK by overseas residents in April 2014 rose by 2%, when compared to April 2013. During the period February 2014 to April 2014, overseas residents made 7% more visits to the UK than in the corresponding period a year earlier and they spent 6% more on these visits. In the 12 months to April 2014 the number of visits to the UK was 8% higher than a year earlier and earnings grew by 11%.
- The estimated number of visits abroad by UK residents in April 2014 was 4.8 million, which is a fall of 2% when compared to the number of visits abroad in April 2013. During the period February 2014 to April 2014, the number of UK residents’ visits abroad decreased by 1% when compared with the corresponding period a year earlier, and they spent 15% less on these visits. In the 12 months to April 2014 the number of visits abroad by UK residents was 4% higher when compared with a year earlier and expenditure on these visits rose by 3%.
- For previously released UK economic indicators visit National Statistics: Link
LONDON
- London’s annual growth in output increased to 3.1% in Q4 2013 from a downwardly-revised 3% in Q3 2013.
- London’s annual employment growth increased to 4.1% in Q4 2013 from 3.9% in Q3 2013.
- Annual house price inflation in London was 16% in Q1 2014, up from 12% in Q4 2013.
- The percentage of the resident working age population who are unemployed and claiming Jobseekers’ Allowance in London fell to 2.7% in May 2014 from 2.8% in April. There were 155,000 seasonally adjusted unemployment claimants in London in May 2014 compared to an upwardly-revised 158,100 in April 2014.
- The Purchasing Managers’ Index (PMI) of business activity recorded 60.4 in May 2014, compared to 62 in April 2014.
- The PMI for new orders for London firms recorded 61.6 in May 2014 unchanged from April 2014.
- The PMI for the level of employment in London firms was 58.2 in May 2014, compared to 55.1 in April 2014.
- The RICS Residential Market Survey shows a positive net balance of 51 for London house prices over the three months to May 2014.
- The net house price expectations balance in London was 26 in May 2014.
- For Greater London, the consumer confidence score increased to 4 in May 2014 from -3 in April 2014.
- In the most recent 26 day period, (from 1 April 2014 to 26 April 2014) London’s underground and buses had 271.7 million passenger journeys; 177.9 million by bus and 93.9 million by Underground.
- The moving average annual rate of growth in passenger journeys decreased to 2.2% from 2.5% in the previous period.
For more information please visit: Link
US
- Real gross domestic product (GDP) decreased at an annual rate of 2.9% in Q1 2014. Corporate profits decreased $198.3 billion (9.1% at a quarterly rate) in Q1.
- In May 2014, personal income increased $58.8 billion, or 0.4%, disposable personal income (DPI) increased $55.6 billion, or 0.4% and personal consumption expenditures (PCE) increased $18.3 billion, or 0.2%.
- The May 2014 international trade deficit decreased 5.6% from April, to $44.4 billion. Exports increased 1%, to $195.5 billion, and imports fell 0.3%, to $239.8 billion.
- The U.S. current account deficit decreased to $81.1 billion or 1.9% of current-dollar gross domestic product (GDP) in Q4 2013, from $96.4 billion, or 2.3% of GDP in Q3.
- The U.S. current account deficit increased to $111.2 billion or 2.6% of GDP in Q1 2014, from $87.3 billion (revised), or 2% of GDP in Q4 2013.
- Real spending on travel and tourism accelerated in Q4 2013, increasing at an annual rate of 4.2% after increasing 3.1% (revised) in Q3 2013. For the year, real spending on travel and tourism increased 3.6% in 2013 after increasing 2.8% in 2012
For previously released US economic indicators visit US Bureau of Economic Analysis (BEA): Link
NY
- Private employment rose in New York City by 3,100 between March and April 2014.
- The unemployment rate fell to 7.9% in April 2014 from 8% percent in March.
- The Manhattan Class A office vacancy rate was 9.7% in May 2014, while the average asking rent was $71 PSF.
- The Manhattan hotel occupancy rate in April 2014 was 92%, up from 89.8% in April 2013.
- Passengers in NYC area airports totaled 9.6 million in March 2014, down 0.2% from March 2013.
- In May 2014, the Manhattan Class A direct vacancy rate fell to 9.7% while the average rental rate rose to $71 PSF.
- In the same month, the Downtown Class A direct vacancy rate fell to 11.7% and the rental rate remained at $55 PSF.
- The Manhattan Class A sublease vacancy rate rose to 1.8% from 1.7% from April to May.
- For the twelve months ending April 2014: Building projects (including new, additions and alterations) that started construction in NYC rose by 13.2%, and infrastructure (non-building) project starts fell by 15.1% from the twelve months ending April 2013.
- Planned space for building project starts rose by 17.1% from the same period in 2013.
- 3,004 residential building project starts began construction, a 17% increase from the twelve months ending in April 2013. These starts contained 24,808 units, an increase of 28.1% from last year.
- In March 2014, 9.6 million passengers flew into and out of the region’s airports, a decrease of 0.2% from March 2013.
- Domestic air carriers accounted for 6.4 million passengers, a 0.1% decrease from March 2013.
- 3.2 million passengers traveled with international air carriers in March 2014, a 0.4% decrease from March 2013.
- Total ridership on MTA subways, trains and buses in April 2014 was 230.1 million, a decrease of 1% from April 2013.
- Subway ridership in April 2014 was 147.9 million, which was a 0.7% increase from April 2013.
- Total Broadway attendance was approximately 1.4 million during the five weeks ending June 1, 2014, up 21.3% from the same period last year.
- Broadway revenue during this period was about $146.8 million, up 20% from last year.
- In April 2014, the average daily hotel room rate was $295, a 2.6% increase from April 2013.
- Hotel occupancy was 92% in April 2014, up from 89.8% in April 2013.
- The average daily hotel room rate increased the most in hotels charging between $325 and $375 per night.
For more information please visit: Link
Euro Zone
- GDP rose by 0.2% in the euro area in Q1 2014, compared with the previous quarter. In Q4 2013, GDP grew by 0.2% in the euro area. Compared with the same quarter of the previous year, seasonally adjusted GDP rose by 0.9% in the euro area in Q1 2014.
- The Euro area unemployment rate was 11.7% in April 2014, down from 11.8% in March 2014, and from 12% in April 2013.
- The Euro area annual inflation was 0.5% in May 2014, down from 0.7% in April.
- In March 2014 compared with February 2014, seasonally adjusted industrial production fell by 0.3% in the euro area. In March 2014 compared with March 2013, industrial production dropped by 0.1% in the euro area.
- In April 2014, compared with March 2014, the industrial producer prices fell by 0.1% in the euro area. In April 2014 compared with April 2013, industrial producer prices decreased by 1.2% in the euro area.
- In April 2014 compared with March 2014, production in the construction sector grew by 0.8% in the euro area. In April 2014, compared with April 2013, production in construction increased by 8% in the euro area.
- In April 2014 compared with March 2014, the volume of retail trade rose by 0.4% in the euro area. In April 2014, compared with April 2013, retail sales index increased by 2.4% in the euro area.
- House prices, fell by 1.4% in the euro area in Q4 2013, compared with the same quarter of previous year. Compared with Q3 2013, house prices fell by 0.7% in the euro area.
- In Q4 2013, business investment rate was 19.5% in the euro area, compared with 19.2% in Q3 2013.
- The first estimate for the euro area trade in goods balance with the rest of the world in March 2014 gave a 17.1 billion euro surplus compared with +21.9 billion in March 2013.
- The EU28 external current account recorded a surplus of 32.2 billion euro (1% of GDP) in Q1 2014, compared with a surplus of 36.3 billion (1.1% of GDP) in Q4 2013 and with a surplus of 34.9 bn (1.1% of GDP) in Q1 2013.
For more information please visit: Link
2. INVESTMENT INDICATORS
UK Inward Investment 2013
Inward investment projects into the UK rose by 15% last year, as it retained its position as Europe’s number one destination for global investors while simultaneously increasing its market share. The 799 projects were the highest number ever secured by the UK according to professional services firm EY’s annual UK Attractiveness Survey.
The overall European market grew by just 4%, meaning the UK secured one-fifth of all European projects, close to its record high over the past decade. Its performance saw the UK extend its lead over second-placed Germany as a Foreign Direct Investment (FDI) destination, as both countries pulled away from the remainder of Europe.
The UK has also moved from eighth to fifth in the worldwide ranking of countries investors regard as attractive for FDI over the next three years – its highest ever position – overtaking Germany for the first time. Only China, the United States, India and Brazil are ahead of the UK.
The UK was the clear leader in attracting projects in the knowledge industries. Software investments surged by more than 50%, meaning the UK secured more than a third of all projects in what is now Europe’s largest FDI sector.
It also attracted 52 research and development (R&D) projects. That was 20% more than Germany, giving the UK a Europe leading market share of 18% R&D FDI. The UK also led the way on headquarters, contact centres, logistics, international distribution centres and sales & marketing projects.
UK Investment Position: Q1 2014
The financial account showed a net inflow (that is, inward investment) of £8.9 billion in Q1 2014, compared with a net inflow of £29.1 billion in Q4 2013.
UK investment abroad increased by £9.9 billion in Q1 2014, from net investment (outflow) of £6.1 billion in Q4 2013 to net investment (outflow) of £16.0 billion in Q1 2014.
Investment in the UK decreased by £10.3 billion in Q1 2014 from net investment of £35.2 billion in Q4 2013 to net investment of £24.9 billion in Q1 2014.
Direct investment recorded a net inflow (that is, inward investment) of £71billion in Q1 2014, a switch from a net outflow of £9.9 billion in Q4 2013.
Direct investment abroad switched in Q1 2014 to disinvestment of £57.5 billion from investment of £15.9 billion in Q4 2013.
Direct investment in the UK increased by £7.4 billion in Q1 2014 to £13.5 billion.
Portfolio investment recorded a net inflow of £23.1 billion in Q1 2014, an increase from a net inflow of £17.2 billion in Q4 2013.
Portfolio investment abroad showed net disinvestment of £16.4 billion in Q1 2014, following a net investment of £18.1 billion in Q4 2013.
Portfolio investment in the UK showed net investment of £6.7 billion in Q1 2014, a decrease from net investment of £35.4 billion in Q4 2013.
Other investment in Q1 2014 recorded net outflows of £68.5 billion compared with net inflows of £37.6 billion in Q4 2013.
Other investment abroad recorded net investment of £73.2 billion in Q1 2014, following net disinvestment of £43.7 billion in Q4 2013.
Other investment in the UK showed net investment of £4.7 billion in Q1 2014, following net disinvestment of £6.2 billion in Q4 2013.
EU Foreign Direct Investment (FDI) 2013
Foreign Direct Investment (FDI) from the EU28 to the rest of the world reached 341 billion euro in 2013, while investment from the rest of the world in to the EU28 was 327 bn. Investment from the euro area to the rest of the world amounted to 324 bn, while investment from the rest of the world into the euro area was 299 bn.
In 2013, the main destination of EU28 investments was by far the USA (159 billion euro) and the main investor into the EU28 was also by far the USA (313 bn).
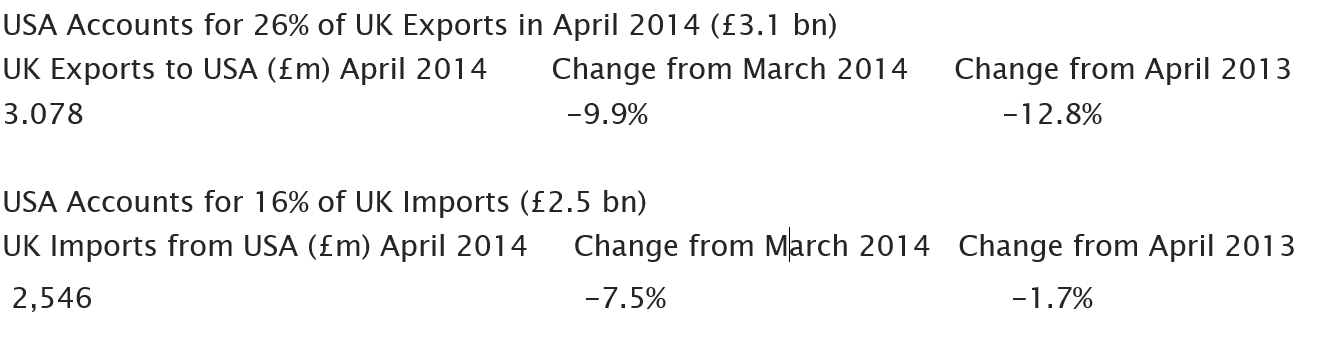
3. UK/US EXPORTS/IMPORTS
4. UK/EU & Non-EU Exports/Imports
Total Monthly UK Trade with EU Member States: April 2014
EU Exports for April 2014 are £11.5 billion. This is a decrease of £2.1 billion (15.8%) compared to last month.
EU Imports for April 2014 are £17.9 billion. This is a decrease of £1.1 billion (5.8%) compared to last month.
The UK remains a net importer, with imports exceeding exports.
Total Monthly UK Trade with non- EU Member States: April 2014
Non-EU Exports for April 2014 are £12 billion. This is a decrease of £1.5 billion (10.9%) compared to last month.
Non-EU Imports for April 2014 are £15.8 billion. This is a decrease of £0.1 billion (0.5%) compared to last month.
The UK is a net importer this month, with imports exceeding exports by £3.8 billion. This is an increase of £1.4 billion (59.9%) compared to last month.
5. NEW INVESTMENTS
US Investments into UK
Cervello opens new office in London
Cervello Inc., a leading professional services and solutions provider focused on improving data management and business analytics for progressive enterprises, has opened a new office in London, UK, and appointed Chris Boulanger, a founding member of the Cervello executive team, as managing director responsible for operations and driving growth in the region.
Cervello Inc, Boston Office – Headquarters, 2 Seaport Lane, 11th Floor, Boston, MA 02210. Tel:617 307 4131, Fax: 617 307 4135 Website: http://mycervello.com/
London Office, 1 Lyric Square, London, W6 0NB
Qriously expands in the UK
New York-based Qriously, a location based public opinion company, has expanded its office in London, UK. and has recruited Phillip Lauria and Jess MacIntyre to lead its marketing operations in the US and the UK, respectively.
Qriously The Grind, 419 Park Ave S, NY 10016. Sales and marketing enquiries, US, Joe Zahtila, Commercial Director. Email:jza@qriously.com Website: www.qriously.com
Qriously, 359 Goswell Rd, London EC1V 7JL. Sales and marketing enquiries, UK, Chris Bourke, Commercial Director EMEA, Email: cbo@qriously.com
Egnyte has opened a new European HQ in London
California-based cloud computing firm Egnyte has opened a new European headquarters in London. The company already has a data centre in Amsterdam to cater to customers who do not wish to or are obliged not to store data in the US. However this is the first office to be established in the region. The opening of the London European HQ means customers in the region will have access to representatives of the business much closer to home who are also in either the same time zone or an adjacent one.
US Headquarters, Egnyte Inc.1350 W. Middlefield Road, Mountain View, CA 94043. Tel: 650 968 4018
Egnyte UK: Tel: 0845 528 0588, Tel: 020 3356 3714 Fax: 610 968 4012 Website: www.egnyte.co.uk
UK Investments into the US
World First Opens new office in the US
UK-based World First, a foreign exchange services and international payments provider, has opened a new office in California. The second office follows the expansion of the company’s first site in Washington, DC, as the rapidly growing firm continues to recruit more staff and significantly increase its client base. The new site in Los Angeles will offer residents of the Golden State access to more competitive exchange rates for international money transfers.
World First UK Ltd, Regent House, 16-18 Lombard Road, London, SW11 3RB. Tel: +44 20 7095 0635 Email: enquiries@worldfirst.com Website: http://us.worldfirst.com/
6. TRADE SHOWS
UK
October 1-2, 2014 – E Commerce Expo 2014 – Olympia, London
Website: Link
E Commerce Expo is positioned to address the processes, technologies and services that surround the e-commerce transaction – acquisition, conversion, fulfilment and customer retention. With over 150 exhibiting companies and over 60 education sessions to choose from, E Commerce Expo is a must for anyone with an interest in e-commerce – whether just getting started or a seasoned multi channel retailer.
Contact: Richard Stanbridge, Senior Commercial Specialist/Head of Industries Team, Tel: +44 (0)20 7894 0437 Email: Richard.Stanbridge@trade.gov
October 8-9, 2014 – IP Expo – ExCel London
Website: Link
“IP EXPO is a true end-to-end IT infrastructure event, offering visitors a rare, once a year opportunity to discover everything they want to know in one place at one time. Visitors can learn about IP, Virtualization, the Cloud, Wireless and Storage technologies – and see how they connect together.
Contact: Richard Stanbridge, Senior Commercial Specialist/Head of Industries Team, Tel: +44 (0)20 7894 0437 Email: Richard.Stanbridge@trade.gov
October 9-11, 2014 – BDTA Dental Showcase – – ExCel London
Website: Link
BDTA is the UK’s premier dental exhibition. Those who have visited Showcase before know just what a superb opportunity it is to see the latest technologies, equipment and sundries all displayed conveniently under one roof and to talk to sales professionals directly. The BDTA has put together a show that is intended to be both educational and enjoyable and to provide a valuable resource for every member of the dental team.
Contact: Cheryl Withers, Commercial Specialist, Tel: +44 (0)20 7894 0419 Email: Cheryl.Withers@trade.gov
US
July 27- 31, 2014 – AACC Annual Meeting & Clinical Lab Expo – Chicago, IL
Website: Link
Connect with global leaders in clinical chemistry, molecular diagnostics, mass spectrometry, translational medicine, lab management, and other areas of breaking science in laboratory medicine. Learn about cutting edge technology. The AACC annual meeting has more than 200 new product introductions each year. Hear vital research and learn about important changes in the field. With more than 200 educational opportunities in Lectures, Plenary Sessions, Symposia, Short Courses and Brown Bag Sessions, you can design an educational experience that best meets your professional needs.
August 17-20, 2014 -MAGIC MARKET PLACE (Summer) 2014 – Las Vegas, NV
Website: Link
MAGIC is the largest global marketplace for contemporary men’s and women’s apparel, footwear, accessories and sourcing resources — and the world’s most comprehensive forum for fashion buyers and brands. Every February and August, the industry convenes in Las Vegas for connection, inspiration and to shop a portfolio of ten expertly merchandised and curated shows across every category, trend and price point. With more than $200 million in orders written daily, MAGIC fuels the business of fashion.
August 20-23, 2014 – International Woodworking Machinery & Furniture Supply Fair- Atlanta, GA
Website: www.iwfatlanta.com
The International Woodworking Fair, LLC is the premier trade show event for the industry. Our business is to connect you with the most qualified buyers in the industry. Buyers come from all over the globe to see, evaluate and buy machinery, supplies and services
August 26-28, 2014-Farm Progress Show – Boone, IA
Website: Link
The Nation’s largest outdoor farm show.
September 27 – October 1, 2014 – WEFTEC 2014 – New Orleans, LA
Website: Link
WEFTEC, the Water Environment Federation’s Annual Technical Exhibition and Conference, is the largest conference of its kind in North America and offers water quality professionals from around the world with the best water quality education and training available today.
For more information please visit: Link