1. ECONOMIC INDICATORS
UK
- Gross Domestic Product (GDP) was estimated to have increased by 0.8% in Q2 2014.
- Consumer Price Index (CPI) annual inflation was 1.9% in June 2014, up from 1.5% in May.
- For April to June 2014, 73% of people aged from 16 to 64 were in work, up by 0.3% from January to March 2014 and up by 1.5 from a year earlier.
- For April to June 2014, pay including bonuses for employees in Great Britain was 0.2% lower than a year earlier, but pay excluding bonuses was 0.6% higher.
- UK house prices increased by 9.9% in the year to April 2014, up from 8.0% in the year to March 2014.
- Production output increased by 1.2% in June 2014, compared with June 2013.
- Manufacturing output increased by 1.9% in June 2014, compared with June 2013.
- In the year to June 2014 the output price index for home sales of manufactured products rose 0.2%. In the same period the total input price index fell by 4.4%.
- The Index of Services increased by 3.6% in June 2014 compared with June 2013.
- In Q2 2014 there was estimated to be no growth in construction output when compared with Q1 2014 however, the annual growth between Q2 2014 and Q2 2013 was estimated to have increased by 4.8%.
- In June 2014, the quantity bought in the retail industry increased by 3.6% compared with June 2013 and by 0.1% compared with May 2014. The quantity bought also increased in Q2 2014 compared with Q2 2013, by 4.5%.
- Public Sector Net Borrowing in June 2014 was £11.4bn. When Asset Purchase Facility transfers are excluded from June 2013, net borrowing was similar.
- In Q1 2014, business investment rose by an estimated £0.9 billion (2.7%) to £32.8 billion compared with the previous quarter and was 8.7% higher compared with Q1 2013.
- The UK’s deficit on seasonally adjusted trade in goods and services was £2.5 billion in June 2014. The deficit on trade in goods was £9.4 billion. The surplus on trade in services was estimated at £7 billion.
- There was a current account deficit of £18.5 billion in Q1 2014, down from a revised deficit of £23.5 billion (originally published as a deficit of £22.4 billion) in Q4 2013.
- Overseas residents made 5.6% more visits to the UK in 2013 compared with 2012. Earnings from visits to the UK rose by £2.4 billion (12.7%) compared to 2012 to reach a record level of spending in the UK of £21 billion.
- In 2013, UK residents made 3.5% more visits abroad than in 2012 and spent £2.5 billion (7.6%) more during these visits.
- The number of visits to the UK by overseas residents in June 2014 rose by 10%, when compared to June 2013.During the period April 2014 to June 2014, overseas residents made 5% more visits to the UK than in the corresponding period a year earlier and spent 6% less on these visits. In the 12 months to June 2014 the number of visits to the UK was 8% higher than a year earlier and earnings rose by 7%.
- The estimated number of visits abroad by UK residents in June 2014 was 5.81 million, which is a fall of 3% when compared to the number of visits abroad in June 2013. During the period April 2014 to June 2014, the number of UK residents’ visits abroad increased by 1% when compared with the corresponding period a year earlier, and they spent 23% less on these visits. In the 12 months to June 2014 the number of visits abroad by UK residents was 5% higher when compared with a year earlier and expenditure on these visits fell by 3%.
- For previously released UK economic indicators visit National Statistics: Link
LONDON
- London’s annual growth in output increased to 3.1% in Q4 2013 from a downwardly-revised 3% in Q3 2013.
- London’s annual employment growth increased to 4.1% in Q4 2013 from 3.9% in Q3 2013.
- Annual house price inflation in London was 25.8% in Q2 2014, up from 18.2% in Q1 2014.
- The percentage of the resident working age population who are unemployed and claiming Jobseekers’ Allowance in London fell to 2.6% in June 2014 from 2.7% in May. There were 149,100 seasonally adjusted unemployment claimants in London in June 2014 compared to a downwardly-revised 154,200 in May 2014.
- The Purchasing Managers’ Index (PMI) of business activity recorded 58.4 in June 2014, compared to 60.4 in May 2014.
- The PMI for new orders for London firms recorded 63 in June 2014 up from 61.6 in May 2014.
- The PMI for the level of employment in London firms was 59.7 in June 2014, compared to 58.2 in May 2014.
- The RICS Residential Market Survey shows a positive net balance of 31 for London house prices over the three months to June 2014.
- The net house price expectations balance in London was -10 in June 2014.
- For Greater London, the consumer confidence score decreased to 2 in July 2014, compared to 4 in June 2014.
- In the most recent 28 day period, (from 25 May 2014 to 21 June 2014) London’s underground and buses had 286.3 million passenger journeys; 188.2 million by bus and 98.2 million by Underground.
- The moving average annual rate of growth in passenger journeys decreased to 1.6% from 1.9% in the previous period.
For more information please visit: Link
US
- Real gross domestic product (GDP) increased at an annual rate of 4% in Q2 2014
- In June 2014, personal income increased $56.7 billion, or 0.4%, disposable personal income (DPI) increased $51.5 billion, or 0.4% and Personal consumption expenditures (PCE) increased $51.7 billion, or 0.4.
- The June 2014 international trade deficit decreased 7% from May, to $41.5 billion. Exports increased 0.1%, to $195.9 billion, and imports fell 1.2%, to $237.4 billion.
- The US current account deficit increased to $111.2 billion or 2.6% of GDP in Q1 2014, from $87.3 billion (revised), or 2% of GDP in Q4 2013.
- Real spending on travel and tourism accelerated in Q4 2013, increasing at an annual rate of 4.2% after increasing 3.1% (revised) in Q3 2013. For the year, real spending on travel and tourism increased 3.6% in 2013 after increasing 2.8% in 2012
For previously released US economic indicators visit US Bureau of Economic Analysis (BEA): Link
NY
- Private employment rose in New York City by 8,700 between April and May 2014.
- The unemployment rate remained at 7.9% between April and May 2014.
- The Manhattan Class A office vacancy rate was 9.5% in June 2014, while the average asking rent was $71 PSF.
- The Manhattan hotel occupancy rate in May 2014 was 94.3%, up from 92.1% in May 2013.
- Passengers in NYC area airports totaled 9.9 million in April 2014, up 6.5% from April 2013.
- In June 2014, the Manhattan Class A direct vacancy rate fell to 9.5% while the average rental rate stood steady at $71 PSF.
- In the same month, the Downtown Class A direct vacancy rate fell to 11% and the rental rate remained at $55 PSF.
- The Manhattan Class A sublease vacancy rate remained at 1.8% from May to June.
- For the twelve months ending May 2014: Building projects (including new, additions and alterations) that started construction in NYC rose by 14.6%, and infrastructure (non-building) project starts fell by 13.5% from the twelve months ending May 2013.
- Planned space for building project starts rose by 7.3% from the same period in 2013.
- 3,019 residential building project starts began construction, an 18.4% increase from the twelve months ending in May 2013. These starts contained 23,929 units, an increase of 16.9% from last year.
- In April 2014, 9.9 million passengers flew into and out of the region’s airports, an increase of 6.5% from April 2013.
- Domestic air carriers accounted for 6.4 million passengers, a 3.3% increase from April 2013.
- 3.5 million passengers traveled with international air carriers in April 2014, a 12.8% increase from April 2013.
- Total ridership on MTA subways, trains and buses in May 2014 was 238.7 million, an increase of 0.6% from May 2013.
- Subway ridership in May 2014 was 152.8 million, which was a 1.3% increase from May 2013.
- Total Broadway attendance was approximately 1.1 million during the four weeks ending June 29, 2014, up 26.6% from the same period last year.
- Broadway revenue during this period was about $117.8 million, up 21.1% from last year.
- In May 2014, the average daily hotel room rate was $319, a 4% increase from May 2013.
- Hotel occupancy was 94.3% in May 2014, up from 92.1% in May 2013.
- The average daily hotel room rate increased the most in hotels charging between $270 and $340 per night.
For more information please visit: Link
Euro Zone
- GDP remained stable in the euro area in Q2 2014. In Q1 2014, GDP grew by 0.2% in the euro area .Compared with the same quarter of the previous year, seasonally adjusted GDP rose by 0.7% in the euro area.
- The euro area unemployment rate was 11.5% in June 2014, down from 11.6% in May 2014, and from 12% in June 2013.
- The euro area annual inflation was 0.4% in July 2014, down from 0.5% in June.
- In June 2014 compared with May 2014, seasonally adjusted industrial production fell by 0.3% in the euro area. In June 2014 compared with June 2013, industrial production remained stable in the euro area.
- In June 2014, compared with May 2014, the industrial producer prices rose by 0.1% in the euro area. In June 2014 compared with June 2013, industrial producer prices decreased by 0.8% in the euro area.
- In May 2014 compared with April 2014, production in the construction sector fell by 1.5% in the euro area. In May 2014, compared with May 2013, production in construction increased by 3.5% in the euro area.
- In June 2014 compared with May 2014, the volume of retail trade increased by 0.4% in the euro area. In May retail trade increased by 0.3% in the euro area. In June 2014, compared with June 2013, retail sales index increased by 2.4% in the euro area.
- House prices, fell by 0.3% in the euro area in Q1 2014, compared with the same quarter of previous year. Compared with Q4 2013, house prices fell by 0.3% in the euro area.
- In Q1 2014, business investment rate was 19.3% in the euro area, compared with 19.5% in Q4 2013.
- The first estimate for the euro area trade in goods balance with the rest of the world in June 2014 gave a 16.8 billion euro surplus compared with +15.7 billion in June 2013.
- The EU28 external current account recorded a surplus of 25.4 billion euro (0.8% of GDP) in Q1 2014, down with a surplus of 32.7 billion (1% of GDP) in Q4 2013 and from a surplus of 32.9 bn (1% of GDP) in Q1 2013.
For more information please visit: Link
2. INVESTMENT INDICATORS
UK Inward Investment Report 2013-2014
- The UK has strengthened its position as the lead country for FDI According to UNCTAD, the UK is the number one country for inward FDI stock in Europe, and only the second in the world after the USA.
- The value of UK inward FDI stock is estimated to have increased by 8.3% during the last year, reaching a record level of US$1,606 billion (£975 billion).
- The UK not only recorded growth in the value of inward FDI stock of 8.3%, it also increased its relative share of the total accumulated FDI stock in European Union (EU) countries by about US$17billion, reaching 19% as of the end of 2013.
- European investors remain the largest holders of FDI stock in the UK (58%), while the USA is the largest single source country (29%).
- According to the Office for National Statistics (ONS), the UK’s inward FDI stock is spread across a range of industry sectors. The largest concentration is in financial services (45%), followed by mining (9%), ICT (8%) and oil, pharmaceuticals and chemicals (6%).
- UK attracted the largest number of FDI projects in Europe during 2013, strengthening its lead position as the most attractive destination for FDI in Europe.
- The UK is the largest recipient of capital investment in Europe. Almost 20% of the total value of capital investments that are destined for Europe land in the UK.
- During 2013/14 the UK continued to consolidate its lead position in the global FDI market by attracting more inward investment projects than ever previously recorded.
- UKTI recorded an unprecedented number of FDI projects – 1,773 – an increase of nearly 14% on 2012/13 figures, which in themselves had shown a marked increase on the previous year. Over 66,000 new jobs were created by international companies investing in the UK economy during the last year, an impressive 12% increase over the previous year. This is the highest number of new jobs recorded since 2000/01. Coupled with nearly 45,000 jobs safeguarded by additional investment into UK operations, FDI contributed over 111,000 jobs to the UK economy in the 2013/14 financial year.
- The growth of investment projects in the UK was driven by unprecedented numbers of expansions of existing investments recorded over the financial year.
- An increase of over 17% year-on-year – to 677 projects, the highest ever recorded – confirms the trend reported last year, of the growing confidence that existing investors have in the UK as their preferred destination for expanding their business.
- New investments also saw a healthy rise of just over 6%, to 820 projects, which in itself is a record for new investments recorded in the UK. There have also been increased numbers of mergers and acquisition-type investments recorded during the last year.
- All the nations of the United Kingdom saw growth in the number of FDI projects reported last year. England, including London, saw an increase of 11% percent, Scotland 10%, Wales 18% and Northern Ireland an impressive 32%.
- These investments have created or safeguarded many jobs across all parts of the UK. On average, each investment project is estimated to have created or safeguarded 63 jobs. Individual investments in Wales and Scotland, on average, had the largest impact in terms of creation or safeguarding of jobs (132 and 87 jobs per project respectively). Each investment in Northern Ireland is associated with 77 jobs, while projects landing in London are estimated to have created or safeguarded on average 44 jobs per project.
- The spread of foreign investments across all parts of the UK demonstrates the strength and attractiveness of the UK in the global FDI market.
- As expected, the US led the way as the largest source of FDI projects for the UK, generating 501 projects, up 27%. This is consistent with the FDI stock figures, which also confirm the USA as the largest source of UK inward FDI.
- European companies also demonstrated increased interest in the UK. The two largest European contributors to FDI in the UK were France and Germany, both delivering over 100 projects, representing rises of 18% and 31% respectively. Activity from the Asia Pacific region was slow to start, but Japan again showed itself to be the key investment partner, delivering 116 projects across a variety of sectors. China too showed commitment to the UK economy, with 88 projects.
- In terms of individual sectors, software and computer services once again accounted for the largest number of investment projects in a single sector (229 projects). Other well-performing individual sectors were the financial services (159 projects) and business and consumer services (128 projects).
CBI Sterling Assets Report – UK Largest Foreign Investor in US
British investment boosts US economy and jobs. The UK is the largest foreign investor in the US, supporting nearly one million jobs across the country, according to the CBI’s sixth annual Sterling assets report. As of year-end 2012, the UK had invested $487 billion in the US – almost $200 billion more than the next largest investor. This represents over 18% of the $2.7 trillion in foreign direct investment held in the US. Of the 943,500 jobs supported by British companies, almost one in four are manufacturing jobs. In addition, the UK is the fifth-largest destination for US goods and services, and the largest by a wide margin in the European Union, with exports totalling $109 billion in 2013. Every single state in America has workers in jobs that are created and sustained by British firms, with the state of New York leading the way in exports to the UK, shipping £5 billion in goods in 2013. Link
UK Investment Position: Q1 2014
- The financial account showed a net inflow (that is, inward investment) of £8.9 billion in Q1 2014, compared with a net inflow of £29.1 billion in Q4 2013.
- UK investment abroad increased by £9.9 billion in Q1 2014, from net investment (outflow) of £6.1 billion in Q4 2013 to net investment (outflow) of £16.0 billion in Q1 2014.
- Investment in the UK decreased by £10.3 billion in Q1 2014 from net investment of £35.2 billion in Q4 2013 to net investment of £24.9 billion in Q1 2014.
- Direct investment recorded a net inflow (that is, inward investment) of £71billion in Q1 2014, a switch from a net outflow of £9.9 billion in Q4 2013.
- Direct investment abroad switched in Q1 2014 to disinvestment of £57.5 billion from investment of £15.9 billion in Q4 2013.
- Direct investment in the UK increased by £7.4 billion in Q1 2014 to £13.5 billion.
- Portfolio investment recorded a net inflow of £23.1 billion in Q1 2014, an increase from a net inflow of £17.2 billion in Q4 2013.
- Portfolio investment abroad showed net disinvestment of £16.4 billion in Q1 2014, following a net investment of £18.1 billion in Q4 2013.
- Portfolio investment in the UK showed net investment of £6.7 billion in Q1 2014, a decrease from net investment of £35.4 billion in Q4 2013.
- Other investment in Q1 2014 recorded net outflows of £68.5 billion compared with net inflows of £37.6 billion in Q4 2013.
- Other investment abroad recorded net investment of £73.2 billion in Q1 2014, following net disinvestment of £43.7 billion in Q4 2013.
- Other investment in the UK showed net investment of £4.7 billion in Q1 2014, following net disinvestment of £6.2 billion in Q4 2013.
US International Investment Position: Q1 2014
The US net international investment position at the end of Q1 2014 was -$5,539.3 billion (preliminary) as the value of U.S. liabilities exceeded the value of U.S. assets (table 1). At the end of Q4 2013, the net position was -$5,383.0 billion (revised). The $156.3 billion decrease in the net position reflected a $108.3 billion decrease in the value of US assets and a $48 billion increase in the value of US liabilities. The US net international investment position decreased 2.9% Q1 2014, compared with a decrease of 7.8% in Q4 2013.
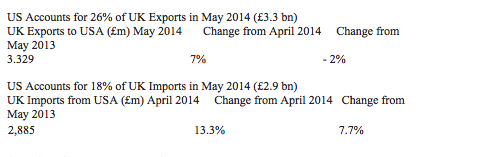
3. UK/US EXPORTS/IMPORTS
4. UK/EU & Non-EU Exports/Imports
Total Monthly UK Trade with EU Member States: May 2014
EU Exports for May 2014 are £12.4 billion. This is an increase of £0.2 billion (1.4%) compared to last month.
EU Imports for May 2014 are £17.5 billion. This is a decrease of £0.3 billion (1.9%) compared to last month.
The UK remains a net importer, with imports exceeding exports by £5.1 billion. This is a decrease of £0.5 billion (9%) compared to last month.
Total Monthly UK Trade with non- EU Member States: May 2014
Non-EU Exports for May 2014 are £13 billion. This is an increase of £0.9 billion (72%) compared to last month.
Non-EU Imports for May 2014 are £16.4 billion. This is an increase of £0.5 billion (2.9%) compared to last month.
The UK is a net importer this month, with imports exceeding exports by £3.4 billion. This is a decrease of £0.4 billion (10.7%) compared to last month.
5. NEW INVESTMENTS
US Investments into the UK
Applexus launches new Office in UK
Applexus Technologies, a Washington-based technology firm announced the opening of its new development and support center at St. John Street, London, UK. Over the years, Applexus have grown to key markets around the globe and offer services to its clients in North America, Asia and Europe.
Applexus Technologies, 33507 9th Avenue South, Federal Way, WA-98003. Tel: 206 249 0900. Website: www.applexus.com
Applexus, 145-157 St John Street, London EC1V 4PW
Merced Capital opens office in London
EBF & Associates, a Minnesota-based firm with more than $2.2 billion of capital under management, has opened a London office as its first overseas operation and changed its name to Merced Capital, according to a statement. The firm, founded in 1988, describes itself as a hybrid between a private equity firm and a hedge fund. It targets deals that are too illiquid for hedge funds but have holding periods of about three to four years, shorter than most private equity deals, which typically last between five and seven years. In addition to buying assets including companies, real estate and aircraft and shipping equipment, Merced invests in homebuilder loans and provides debt and equity financing. Andrew Platt, is the Managing Director at Merced and head of the London office.
Merced Capital, 601 Carlson Parkway, Suite 200, Minnetonka, MN 55305. Website: www.mercedcapital.com
Merced Capital (UK), 1 Berkeley Street, London W1J 8DJ. Andrew Platt, Managing Director, Tel: +44 (0)20 7016 9672 Email: andrew.platt@mercedcapital.com
DocAuto opens first office in UK
In response to increasing market demand, DocAuto, a globally trusted leader in enterprise content management (ECM) applications, has announced the launch of an office in the United Kingdom. This expansion will provide DocAuto’s vast regional clientele with a direct channel to DocAuto’s ECM expertise. It will also further facilitate our long-term goal of becoming the premier enterprise content management tool provider for WorkSite and SharePoint in the United Kingdom and across Europe.
DocAuto, Inc. 5430 Metric Place Suite 150, Norcross, GA 30092. Tel: 770 242 6746 Website:http://www.docauto.com/
UK Investments into the US
Austin Fraser plans to open office in the US
British-based Austin Fraser, an IT and engineering recruiting company, will open an Austin office in early 2015. This is the second company from across the pond to have recently announced its investment in Austin. SafeGuard World International Inc. in the United Kingdom is relocating its headquarters to Austin, which the Austin Business Journal reported previously. Austin Fraser is opening a satellite office here with about six employees to start.
Austin Fraser, The Forbury, Reading, Berkshire RG1 3BB. Tel: 0118 959 6689. Website: www.austinfraser.com
Chaucer opens Miami office
Chaucer, the specialist Lloyd’s insurance group, is opening an office in Miami, Florida during the fourth quarter of 2014. Uwe Fischer, Region Development Director for Latin America, will relocate from Buenos Aires to lead the new office. He will be joined by Property Facultative Underwriter Alejandro Ferrin. The new office extends the reach of Chaucer’s international operations, and recognises the increasing importance of Miami as a hub to the rapidly expanding Latin American market
Chaucer plc, Plantation Place, 30 Fenchurch Street, London EC3M 3AD. Tel: +44 (0)20 7397 9700 Fax: +44 (0)20 7397 9710 Email: enquiries@chaucerplc.com website: www.chaucerplc.com
Chaucer, 3200 SW Freeway, Suite 1130, Houston Texas 77027. Tel: 713- 260 1032
6. TRADE SHOWS
UK
October 1-2, 2014 – E Commerce Expo 2014 – Olympia, London
Website: Link
E Commerce Expo is positioned to address the processes, technologies and services that surround the e-commerce transaction – acquisition, conversion, fulfilment and customer retention. With over 150 exhibiting companies and over 60 education sessions to choose from, E Commerce Expo is a must for anyone with an interest in e-commerce – whether just getting started or a seasoned multi channel retailer.
Contact: Richard Stanbridge, Senior Commercial Specialist/Head of Industries Team, Tel: +44 (0)20 7894 0437 Email: Richard.Stanbridge@trade.gov
October 8-9, 2014 – IP Expo – ExCel London
Website: Link
“IP EXPO is a true end-to-end IT infrastructure event, offering visitors a rare, once a year opportunity to discover everything they want to know in one place at one time. Visitors can learn about IP, Virtualization, the Cloud, Wireless and Storage technologies – and see how they connect together.
Contact: Richard Stanbridge, Senior Commercial Specialist/Head of Industries Team, Tel: +44 (0)20 7894 0437 Email: Richard.Stanbridge@trade.gov
October 9-11, 2014 – BDTA Dental Showcase – – ExCel London
Website: Link
BDTA is the UK’s premier dental exhibition. Those who have visited Showcase before know just what a superb opportunity it is to see the latest technologies, equipment and sundries all displayed conveniently under one roof and to talk to sales professionals directly. The BDTA has put together a show that is intended to be both educational and enjoyable and to provide a valuable resource for every member of the dental team.
Contact: Cheryl Withers, Commercial Specialist, Tel: +44 (0)20 7894 0419 Email: Cheryl.Withers@trade.gov
US
August 26-28, 2014-Farm Progress Show – Boone, IA
Website: Link
The Nation’s largest outdoor farm show.
September 27 – October 1, 2014 – WEFTEC 2014 – New Orleans, LA
Website: Link
WEFTEC, the Water Environment Federation’s Annual Technical Exhibition and Conference, is the largest conference of its kind in North America and offers water quality professionals from around the world with the best water quality education and training available today.
For more information please visit: Link